Adverse drug reaction (ADRs) refer to the drug-associate adverse incidents in which drugs are used at an appropriate dose and indication. The ADRs can complicate a patient’s medical condition and even death. Discovering unknown adverse drug reactions (ADRs) in postmarketing surveillance as early as possible is of great importance.\ The important of the early detection of a ADR connected to a drug is one of the focus of the Quality Health Committee. In their work @national2000To, they report that starting from the year $2000$, there were about $100000$ deaths in U.S. due to medical errors, of which about $7000$ were attributed to drug reactions. Laser et al. @doi:10.1001/jama.287.17.2215 find that between $1975$ and $1999$, $548$ new drugs were approved by the food and drug administration (FDA), $16 (2.9 \%)$ of which were subsequently withdrawn from the market because of ADRs. Forty-five $(8.2 \%)$ of the $548$ drugs acquired at least one black box warning for an ADR that was not known when the drug was approved by the FDA for marketing (a black box warning is required by the FDA to appear in the drug package insert as well as in the Physicians’ Desk Reference @deskref if substantial risk to the patient may occur or if additional information or monitoring of drug use might prevent an adverse event.) Laser et al. @doi:10.1001/jama.287.17.2215 also pointed out that “Many serious ADRs are discovered only after a drug has been on the market for years. Only half of newly discovered serious ADRs are detected and documented in the Physicians’ Desk Reference @deskref within $7$ years after drug approval.” Drug safety depends heavily on postmarketing surveillance: the systematic detection and evaluation of medicines once they have been marketed. At that time, the safety information is only obtained from a few thousand people in a typical pre-marketing clinical trial. Clinical trials are not capable of detecting rare ADRs because of limitations in sample size and trial duration. Early detection of unknown ADRs could save lives and prevent unnecessary hospitalizations.

Literacy review {#sec:rew .unnumbered}
Current methods largely rely on spontaneous reports (MedWatch) which suffer from serious underreporting $(<10 \% \mbox{ of reporting rate})$, latency, and inconsistent reporting @Klein2005. Thus they are not ideal for rapidly identifying rare ADRs.
MedWatch is a passive system in that it depends on voluntary, spontaneous reports of suspected ADRs to be filed by healthcare professionals, drug manufactures, and/or consumers using the system’s online forms. Detection of an ADR generally relies on FDA’s retrospective or concurrent review of patient cases. Because ADR reports are filed at the discretion of the users of the system, there is gross underreporting @15073889, @16689555. Moreover, it depends on human recognition of a potential link between a drug and an apparent adverse reaction (called signal pair), and on the time to report the observation @16953518. In addition, the rate at which cases are reported is dependent on many factors, including the time period since the drug was released into the market place, pharmacovigilance-related regulatory activity, the indications for use of the drug (which impacts prescribing frequency), and finally, the passive surveillance system is limited by latency and inconsistent. Consequently, the current approach may require years to identify and withdraw problematic drugs from the market, and result in unnecessary mortality, morbidity, and cost of health care.\
Proposed Technique {#proposed-technique .unnumbered}
Black-box warning predictions may be classified as passive or active programs @Ji:2010:DCI:1827616.1827651. Passive programs base predictions from data that is accumulated throughout a period of time. Such data includes the Adverse Event Reporting System (AERS) that collectively archives a spontaneous list of drug and adverse events in which physicians voluntarily report. Active programs seek out information to determine possible adverse reactions using techniques such as data mining.\ The limitation of passive approaches is that the data, for instance AERS, requires that humans voluntarily log the data and primarily, humans must be able to identify the drug and ADRs as a problem. As a result there is an underreporting of data, making rare drug and ADR pairs difficult to detect @15073889 [@16689555]. The problem with active systems in predicting black-box warnings is that mining enough false, purposely incorrect, or redundant information can skew results.\ In this project, we propose an approach that incorporates features from both passive and active black-box warning prediction programs. In this case, the classification (or misclassification) of a drug and ADRs pair is not exclusively due to human underreporting (spontaneous reports) or overreporting (web data). More specifically, we propose to use data from the AERS tables and web information to determine if a black-box warning is issued for some drug $D$ and some adverse drug reaction $A$.
Formulation of the Problem {#formulation-of-the-problem .unnumbered}
For a drug $D$ and an adverse reaction (ADR) $A$, the problem is to detect when a blackbox warning (BBW) between $D$ and $A$ will occur. The issue with this statement is that the target can be considered continuous, i.e. month and year, and therefore setup the problem to more of a time series question. If the aforementioned problem were to be considered a classification problem, a lot of data would be required, which is not a realistic expectation since obtaining negative data is also an issue. (A future section will addresses the negative data problem.) Instead, we observe the problem of detecting BBWs in terms of an existence problem. For a drug $D$ and an ADR $A$, the problem is to detect the existence of a BBW between $D$ and $A$ before the official BBW date (see scenario one in the experiment section). This is a discrete classification problem. In this work, we avoid the hassle of obtaining advanced degrees in medical sciences and the rigor of studying medications in terms of biology/chemistry and instead, we analyze sequences of data to detect a BBW. More specifically, we analyze physician-logged reports and data based on Web search trends, extract features, and apply machine learning to apply the features to solve BBW detection from a data-driven perspective.
Data & Feature Extraction Methods {#data-feature-extraction-methods .unnumbered}
A prerequisite to any machine learning task is to collect the right data. In our case of blackbox warning detection, we had initially anticipated this step, along with feature extraction, to be straightforward. However, this step proved to be quite grueling, requiring roughly $2500$ lines of Java source code – using the Netbeans environment and Java version 1.7.0_09 – for conversion of raw data to more than $1000$ Apache Derby tables, querying of data from various tables, analyzing data to extract features, dealing with incomplete data, generating examples, etc. In this section, we discuss in detail the process from data gathering to feature extraction.
Examples {#examples .unnumbered}
We were provided with around $120$ positive examples in the form $<D,A,W>$ from the FDA BBW table (see table [table:fdabbwtable]), where $D$ is a set of drug synonyms $d\in D$, $A$ is a set of adverse reaction (ADR) synonyms $a\in A$ based on the all Medical Dictionary for Regulatory Activities (MedDRA), and $W$ is the month and year of the blackbox warning (BBW) between $D$ and $A$. A limited set of these examples is shown in Table [table:fdabbwtable]. We shall denote this table by $FDABBW$. You see that each $d\in D$ and each $a\in A$ provides a list of alternative keywords for more extensive data analysis. The problem with the data provided in $FDABBW$ is that all of the examples are positive instances. This is one of the challenges with BBW detection. Even though all of the provided examples are instances with a BBW, the ML problem that we want to address is not a one-class classification problem; there are indeed drugs without blackbox warnings. Without training as a physician, biologist, or chemist, we devise methods of generating negative and auxiliary data using the originally provided data. Each example is labeled with the metadata documented in Table [table:featuresmetadata].
Drug ADR BBW date ———————————– ———————————————————— ———- cipro OR proquin OR ciprofloxacin tendonitis OR tendon rupture Oct-08 cimzia OR certolizumab infection Jan-09 chantix OR varenicline suicide OR suicidality OR suicidal OR depression Jul-09 simponi OR golimumab lymphoma OR malignancy OR tumor OR cancer Nov-09 fludara OR fludarabine OR forta coma OR seizures OR agitation OR confusion Feb-09 aptivus OR tipranavir Intracranial hemorrhage OR intracranial bleeding OR stroke Aug-06 . . . . . . . . .
|p15cm|
**: Number representing the drug/ADR pair.\
**: The actual classification of the example, where 1=YES_INSTANCE and 0=NO_INSTANCE.\
Simulating Examples
Given that $FDABBW$ possesses triples $<D,A,W>$ of positive instances, we can generate data by exploiting the fact that there is a known relationship between each $d\in D$ and $a\in A$. That is, for two arbitrary triples $<D_1,A_1,W_1>,<D_2,A_2,W_2>\in FDABBW$, there is a high probability that the triple $<D_1,A_2,W^>\notin FDABBW$ for any $W^$. By choosing some $W^$, say $W^=W_1$, the resulting instance with drug set $D_1$ and ADR set $A_2$ is likely a negative instance. We use this idea to simulate negative examples using the $\texttt{make_NEGATIVE}$ function that uses $\texttt{negative_crossover}$ in Listing [algorithm:crossover], which are displayed as in the source code. The function $\texttt{make_NEGATIVE}$ randomly chooses two positive instances and replaces the ADR via the aforementioned $\texttt{negative_crossover}$ scheme such that (1) the resulting drug and ADR sets are not in the $FDABBW$ table and (2) the negative instance was not previously generated.
public bbw_record $\texttt{negative\_crossover}$(bbw_record b){
    String[] drugs=new String[b.getDrug().length];
    for(int i=0; i<b.getDrug().length; i++)
        drugs[i]=new String(b.getDrug()[i]);
    b=new bbw_record(this);
    b.setDrug(drugs);
    b.setId(-1*b.getId());
    return b;
}
public static void $\texttt{make\_NEGATIVE}$(String table_name,ArrayList<bbw_record> bb,
             int num,int search_first_n_of_bb,int offset,int start_numbering){
    int finished=0;
    Random rg=new Random();
    ArrayList<bbw_record> negative_data=new ArrayList<bbw_record>();
    ArrayList<Integer[]> cross_ids_parents=new ArrayList<Integer[]>();
    int newid=0,parent1=0,parent2=0;
    while(finished<num){
        int r1=rg.nextInt(search_first_n_of_bb)+offset;
        parent1=bb.get(r1).getId();
        int r2=rg.nextInt(search_first_n_of_bb)+offset;
        parent2=bb.get(r2).getId();
        if(r1!=r2){
            bbw_record bbb=new bbw_record(bb.get(r2));
            bbb=bb.get(r1).$\texttt{negative\_crossover}$(bbb);
            boolean neg=true;
            for(int k=0; k<bb.size(); k++){
                if(bbw_record.same_drug_and_adr(bb.get(k),bbb)) neg=false;
            }if(neg) {
                newid=-start_numbering-finished;
                bbb.setId(newid); System.out.println(bbb);
                boolean unique=true;
                for(int qq=0; qq<negative_data.size(); qq++){
                    if(bbw_record.same_drug_and_adr(negative_data.get(qq),bbb))
                            unique=false;
                }if(unique){
                    finished++;
                    negative_data.add(bbb);
                    Integer[] iarr={newid,parent1,parent2};
                    cross_ids_parents.add(copy_int_arr(iarr));
                }
            }
        }
    }
    /* Create table and populate with negative data generated */
}
For additional positive and negative data, we can reuse the same triples from $FDABBW$ by acknowledging the date of the existence of a BBW. Let $W+_dy$ add $y$ months to the BBW date $W$. For the triple $<D,A,W>\in FDABBW$, we say that $<D,A,W-_d15>$ is a negative instance since activity forcing the application of a BBW should be closer to $W$ than $W-_d15$. Also, we can say that $<D,A,W+_d15>$ is a positive instance since the BBW is historical to this particular instance. By simulating additional examples, we can more clearly address our ML problem as a classification problem.
|p15cm|
**: Number of times that drug (signified by ID) occurs in AERS table before blackbox warning.\
**: Number of times that ADR (signified by ID) occurs in AERS table before blackbox warning.\
**: Number of times that drug and ADR (signified by ID) occur together in AERS table before blackbox warning.\
**: Number of times that AERS_NUM_DRUG_ADR instances are labeled with a SERIOUSNESS code != “OT” (other).\
**: Weekly signal for AERS_NUM_DRUG_ADR_SERIOUS cases with “DE” death seriousness code (death) for the year before the blackbox warning.\
**: Considers “LT” seriousness code (life-threatening).\
**: Considers “HO” seriousness code (hospitalization).\
**: Considers “DS” seriousness code (disability).\
**: Considers “CA” seriousness code (congenital anomaly).\
**: Considers “RI” seriousness code (required intervention to prevent permanent impairment/damage).\
**: Considers “OT” seriousness code (other).\
**: Respective cumulative signal.\
**: Respective cumulative signal.\
**: Respective cumulative signal.\
**: Respective cumulative signal.\
**: Respective cumulative signal.\
**: Respective cumulative signal.\
**: Respective cumulative signal.\
**: Weekly signal for AERS_NUM_DRUG_ADR_SERIOUS cases with “DE” seriousness code (death) for the year after the blackbox warning.\
**: Considers “LT” seriousness code (life-threatening).\
**: Considers “HO” seriousness code (hospitalization).\
**: Considers “DS” seriousness code (disability).\
**: Considers “CA” seriousness code (congenital anomaly).\
**: Considers “RI” seriousness code (required intervention to prevent permanent impairment/damage).\
**: Considers “OT” seriousness code (other).\
**: Respective cumulative signal.\
**: Respective cumulative signal.\
**: Respective cumulative signal.\
**: Respective cumulative signal.\
**: Respective cumulative signal.\
**: Respective cumulative signal.\
**: Respective cumulative signal.\
AERS Data {#aers-data .unnumbered}
The Adverse Event Reporting System (AERS) is a reporting system from the FDA in which physicians choose to log instances of patient care in which drug adverse reactions are suspected to exist, available at http://www.fda.gov/Drugs/GuidanceComplianceRegulatoryInformation/Surveillance/AdverseDrugEffects on a quarterly basis since 2004. Each quarterly dataset is composed of 8 ASCII text files: a demographic file DEMO, a drug file DRUG, an indications file INDI, an outcomes file OUTC, a reactions file REAC, a report sources file RPSR, a therapy file THER, and a statistics file STAT. After downloading all of the quarters of AERS data, we develop a set of routines to parse the raw text and generate Apache Derby tables for each file except for STAT, which is more of a human readable file than a program readable file. In generating the tables from 2004 to 2011, we battled many obstacles including erroneous symbols and newline characters disconnecting records. The resulting library of data is roughly 200 tables, which would prove quite valuable for the detailed queries and analysis required. A number of routines were developed to extract the features in Table [table:featuresaers] from the library of AERS data.
Feature Extraction
We write algorithms to extract the features described in Table [table:featuresaers] from the generated AERS tables. In order to address our BBW classification problem, we extract features for each instance $<D,A,W>$ by strictly analyzing data in the AERS files starting from year 2004, quarter-1 until one quarter before the date $W$. In this way, the generated feature will only consider physician reports before the BBW between $D$ and $A$ was applied by the FDA. When generating the features from the AERS data, the main files of interest are the DEMO, DRUG, REAC, and OUTC files. For $AERS_NUM_DRUG$, we oracle the DRUG file for each quarter prior to $W$ to count the number of times that any $d\in D$ is reported. For $AERS_NUM_ADR$, we count the number of times that $a\in A$ is reported in the REAC file between 2004 and one quarter prior to $W$. We cross the results of $AERS_NUM_DRUG$ and $AERS_NUM_ADR$ to create the feature $AERS_NUM_DRUG_ADR$, by sorting the individual results based on the relational $ISR$ number and counting the number of times that there exist the same $ISR$ in both lists. When a patient’s current status is severe, the physician can decide to log a classification of the seriousness in the OUTC file. The serious outcomes are DE (death), LT (life-threatening), HO (hospitalization), DS (disability), CA (congenital anomaly), RI (required intervention to prevent permanent impairment/damage), and OT (other). To generate the feature $AERS_NUM_DRUG_ADR$, we use the $ISR$ field from the $AERS_NUM_DRUG_ADR$ results and count the number of seriousness codes that were logged. Finally, we generate a number of signals based on the seriousness code vs. the time before and after $W$. Specifically, we produce a weekly (and cumulative) signal for each seriousness code logged for $D$ and $A$ for the year prior and the year following $W$. The fact that the signal is weekly requires that we observe the date $EVENT_DT$ in the respective DEMO table. In many cases, this date is an empty field, since the report already has a partial ordering due to its appearance in the quarterly table. In the case of incomplete $EVENT_DT$ fields, we use the following policy: use $FDA_DT$, if empty use $REPT_DT$, if empty use $MFR_DT$, otherwise disregard the case. In the source file Data.java, a number of routines accomplish the aforementioned methods by dynamically creating queries, running the queries, and working with partial results. For the number of queries submitted to the Derby server, it was observed that working with partial results, analyzing the results, and combining them appropriately was much more efficient than requiring the server to execute a complicated query.
Google Trends Data {#google-trends-data .unnumbered}

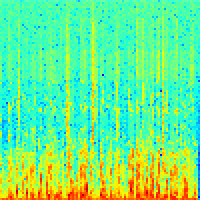
Google Trends (http://www.google.com/trends/ see figure [fig:googleT]) is a feature of Google where various statistics are available regarding the search trends between up to 5 keywords at once. Consider keywords $k_1$, $k_2$, …, and $k_5$. Google Trends displays graphs denoting the popularity of the search by week since 2004 to present date, normalized by the most popular keyword $k_i$, $1\leq i\leq 5$. These signals are analyzed in terms of city and region. The Google Trends feature also displays the most popular searches including the individual word $k_i$. A csv file can be downloaded to furtuer process or analyze the statistics. For each positive instance in $FDABBW$ and each negative instance developed via $\texttt{negative_crossover}$, we manually downloaded the aforementioned csv file for some drug and ADR keywords. Our program has the ability to accept a collection of this raw data and develop 2 Apache Derby tables for each instance – one table for the weekly signals and another table for the collection most popular searches for all keywords $k_i$ – yielding about 800 tables. The tables make analysis much more convenient. Using the generated tables, we develop a number of algorithm to extract the features that are described in Table [table:featurestrends].
Feature Extraction
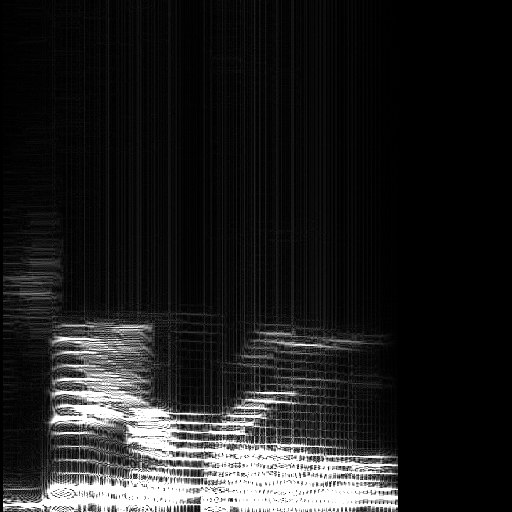
The AERS feature extraction is an extensive programming exercise with scenarios dealing with incomplete data. Extracting features from the Google Trends data is more involved and requires more closely analyzing the signals. See Figure [fig:gtrends] for a specific example of features that we extract from Google Trends data for the positive example $<$cipro OR proquin OR ciprofloxacin, tendonitis OR tendon rupture, Oct-08$>$. For those reading this print in black-and-white, please note that the ordering of the graphs is respective to the ordering in the legend. Since Google Trends only allows up to 5 keywords per search, we enter cipro, proquin, tendonitis, and tendon rupture; we omit ciprofloxacin because when we process the $FDABBW$ table examples, we only consider the shorter keywords in the case that one keyword (cipro) is a prefix of another keyword (ciprofloxacin). The proquin graph is omitted from the Google Trends due to the inferior popularity of the keyword search when compared to the other keywords. We generate one signal for each drug by summing the signals for each drug keyword. The same is done for ADRs. Note that the resulting signal ADRs is shown in the figure. We analyze the resulting drug and ADR summed signals (in this case, the signals cipro and ADR) from the earliest date in 2004 to one quarter before the BBW. In the aforementioned time range, we look at the specified signals first for the overall Pearson correlation ($TRENDS_DRUG_ADR_SEARCH_PEARSON_CORRELATION$). We cannot expect to obtain perfect correlation between two signals for such a long period of time. So, we introduce the idea of $\Delta$-week correlation, that is, correlation between the drug and ADR signals over a window of $\Delta$ weeks. The algorithm to compute this is displayed in Listing [algorithm:deltawkcorrel]; our program uses $\Delta=5$. In the Figure [fig:gtrends] example, we see that the maximum $\Delta$-week correlations are $>.9$ and correspond to similarities of increased keyword search between the drugs and ADRs. This could not be naïvely found using the overall Pearson correlation of about $.58$. The top-3 $\Delta$-week correlations are used as features.
We also analyze the summed drug and ADR signals for situations where both signals simultaneously increase in slope over the span of $\Gamma$ weeks, i.e. $TRENDS_COUNT_GAMMA_WEEK_INCREASED_SLOPE$. This feature is counted if the current set of $\Gamma$ weeks has a simultaneous increase in the slope of both the drug and ADR signal over the previous $\Gamma$ weeks. We also extract the number of peaks, i.e. feature $TRENDS_COUNT_GAMMA_WEEK_PEAKS$, by using the methods mentioned to extract $TRENDS_COUNT_GAMMA_WEEK_INCREASED_SLOPE$. We identify a peak when (1) the previous $\Gamma$ weeks increase in slope simultaneously between both drug and ADR signals and (2) the current $\Gamma$ set of weeks decrease in slope simultaneously between the signals. Restricted, or limited, signals are given lighter restrictions for detecting peaks. Listing [algorithm:gammawkpeak] counts both the cases of increased slope and the number of peaks present in the signals over $\Gamma$ weeks. In our program, we set $\Gamma=5$.
As mentioned earlier, we also store the top searches between keywords from a drug set $D$ and an ADR set $A$ as presented within the Google Trends csv script. For $TRENDS_COUNT_DRUG_ADR_HOT_RESULTS$, we count the number of top searches with some $d\in D$ and some $a\in A$. This feature signifies the overall popularity between a drug and an adverse reaction. Listing [algorithm:hottrend] displays the function used to extract this feature.
public static void $\texttt{delta\_week\_correlation}$(int NUM_CORRELATIONS,int DELTA_WEEKS,
       ArrayList<Double> correlations,double[] drugs_search_arr,
       double[] adr_search_arr){
    for(int i=0; i<drugs_search_arr.length-DELTA_WEEKS; i++){
        double a[]=new double[DELTA_WEEKS];
        double b[]=new double[DELTA_WEEKS];
        int v=0;
        for(int j=i; j<i+DELTA_WEEKS; j++){
            a[v]=drugs_search_arr[j];
            b[v]=adr_search_arr[j];
            v++;
        }double r=Correlation.getPearsonsCorrelation(a,b);
        correlations.add(r);
    }Collections.sort(correlations);
    for(int i=correlations.size()-NUM_CORRELATIONS-1; i>=0; i--)
        correlations.remove(i);
}

public static double[] gamma_week_slope(int GAMMA_WEEKS,
       double[] $\texttt{drugs\_search\_arr}$,double[] adr_search_arr){
    double increased_slope=0;
    double peaks=0;
    for(int i=GAMMA_WEEKS; i<=drugs_search_arr.length-GAMMA_WEEKS; i+=GAMMA_WEEKS)
    {
        double LIMITED_SIGNAL=.05;
        double diff1=0,diff2=0,diff3=0,diff4=0;
        diff1=drugs_search_arr[i-1]-drugs_search_arr[i-GAMMA_WEEKS];
        diff2=drugs_search_arr[i+GAMMA_WEEKS-1]-drugs_search_arr[i];
        diff3=adr_search_arr[i-1]-adr_search_arr[i-GAMMA_WEEKS];
        diff4=adr_search_arr[i+GAMMA_WEEKS-1]-adr_search_arr[i];

        if(drugs_search_arr[i-1]/(double)adr_search_arr[i-1]<LIMITED_SIGNAL){
            if(drugs_search_arr[i-1]==drugs_search_arr[i-GAMMA_WEEKS]) diff1=diff3;
            if(drugs_search_arr[i+GAMMA_WEEKS-1]==drugs_search_arr[i]) diff2=diff4;
        }else if(adr_search_arr[i-1]/(double)drugs_search_arr[i-1]<LIMITED_SIGNAL){
            if(adr_search_arr[i-1]==adr_search_arr[i-GAMMA_WEEKS]) diff3=diff1;
            if(adr_search_arr[i+GAMMA_WEEKS-1]==adr_search_arr[i]) diff4=diff2;
        }

        if(diff1>0 && diff3>0 && diff2<0 && diff4<0) peaks++;
        else if(diff2>diff1 && diff4>diff3) increased_slope++;
    }double[] tmp={peaks,increased_slope};
    return tmp;
}

public static double $\texttt{getHotTrends}$(ArrayList<String[]> results,bbw_record b){
    double freq=0;

    if(results==null) return freq;

    String[] keep_fields=TRENDS_top_search_fields;
    String[] d=b.getDrug();
    String[] a=b.getADR();
    String tablename=makeHotTrendsTableName(b.getId());

    String repl1="<1>", repl2="<2>";
    String query="SELECT * FROM "+tablename+" WHERE "+TRENDS_top_search_fields[0]+
        " LIKE '%"+repl1+"%' AND "+TRENDS_top_search_fields[0]+" LIKE '%"+repl2+"%'";

    for(int i=0; i<d.length; i++){
        for(int j=0; j<a.length; j++){
            String[] words=a[j].split(" ");
            for(int q=0; q<words.length; q++){
                                if(words[q].length()<4) continue;
                String query2=query.replaceAll(repl1,d[i]).replaceAll(repl2,words[q]);
                try{
                    Data.execute_query(query2);
                    if(rs!=null){
                        while (rs.next()) {
                            String[] arr = null;
                            arr = new String[keep_fields.length];

                            for (int k = 0; k < keep_fields.length; k++) {
                                String val = rs.getString(keep_fields[k].toUpperCase().trim());
                                arr[k] = new String(val);
                                if(k+1==keep_fields.length) freq+=new Double(val);
                            }
                            results.add(str_arr_copy(arr));
                        }
                    }
                }catch (Exception e) {
                    System.out.println("\n*** getHotTrends ***\n\n");
                    e.printStackTrace();
                }
            }
        }
    }return freq;
}
Feature Combinations {#feature-combinations .unnumbered}
We notice that by combining the features within the AERS feature set of Table [table:featuresaers] and the Google Trends feature set in Table [table:featurestrends], we can produce a number of additional attributes that are potentially better to distinguish between the positive and negative instances.
Consider first the AERS table. For an example $<D,A,W>$, the following formulation of $\alpha_1$ is a metric determining the percentage of physician reports where some $d\in D$ and some $a\in A$ are common to a patient’s case compared to those cases of $d$ and $a$ with a “seriousness” classification designated. In a situation where a fair percentage of these $d$ and $a$ instances are considered serious by a physician, the value $\alpha_1$ can help clarify the adverse connection between $d$ and $a$.\ $\alpha_1=\displaystyle\frac{AERS_NUM_DRUG_ADR_SERIOUS}{AERS_NUM_DRUG_ADR}$\
Another useful statistic is determining the percentage of patient cases associated with a drug and an ADR as compared to the number of overall cases with that drug or the number of overall cases with that ADR. This metric is formalized in $\alpha_2$.\ $\alpha_2=\displaystyle\frac{AERS_NUM_DRUG_ADR}{\texttt{min}( AERS_NUM_DRUG, AERS_NUM_ADR )}$\
Consider the Google Trends table. We cannot expect the entire drug and ADR signals to correlate perfectly. Instead, we would like a positive instance to have some positive correlation between the entire drug and ADR signal and very high $\Delta$-week positive correlations. By averaging the correlations and weighting them by the number of simultaneous peaks and increased slope between the signals, we ensure that signals (1) have some notion of positive correlation and (2) behave similar during critical weeks. This statistic is shown in $\alpha_3$. For BBW detection, we want $\alpha_3>0$ because when $\alpha_3\leq 0$, the drug and ADR signals either have overwhelming negative correlation and/or the signals do not behave similarly during critical weeks. Let $v=\sum_{yy=1}^c [TRENDS_MAXyy_DELTA_WEEK_PEARSON_CORRELATION]$. In our case, $c=3$ since we only store the top-$3$ correlations between $\Delta$ adjacent weeks of the drug and ADR signals. The combination $\alpha_3$ is defined below.
$\alpha_3=\displaystyle \frac{TRENDS_DRUG_ADR_SEARCH_PEARSON_CORRELATION+v}{c+1} $\
$\ \ \ \ \ \ \ \ \ \ \times\ \texttt{min}( TRENDS_COUNT_GAMMA_WEEK_PEAKS,$\
$\ \ \ \ \ \ \ \ \ \ \ \ \ \ \ \ \ \ \ TRENDS_COUNT_GAMMA_WEEK_INCREASED_SLOPE)$\ Other combinations are possible including crossing AERS-related features with Google Trends-related features. However, the feature $\alpha_4=TRENDS_COUNT_DRUG_ADR_HOT_RESULTS$ in addition to the previously mentioned combinations, on a conceptual level, differentiate positive and negative instances by (1) obtaining physicians’ expert opinions (by $\alpha_1$), (2) determining the percentage of drug and ADR problems logged (by $\alpha_2$), (3) identifying a sophisticated relationship between the search trends of a drug and ADR (by $\alpha_3$), and (4) realizing that the search between both a drug and ADR is also popular (by $\alpha_4$).
|p15cm|
**: Let drug (ADR) signal be the sum of all drug (ADR) signals from Google Trends. This feature is the Pearson correlation between the entire drug signal and the entire ADR signal.\
**: The maximum Pearson correlation between DELTA weeks of drug and ADR signal.\
**: The next maximum correlation of TRENDS_MAX1_DELTA_WEEK_PEARSON_CORRELATION.\
**: The next maximum correlation of TRENDS_MAX2_DELTA_WEEK_PEARSON_CORRELATION.\
**: Count of the number of simultaneous peaks over GAMMA weeks between drug and ADR signals.\
**: Count of the number of simultaneous increases in slope over GAMMA weeks between drug and ADR signals.\
**: Count of the number of hot trend searches between both a drug and ADR, as specified by the ID.\
[table:featurestrends]
Machine Learning Techniques {#machine-learning-techniques .unnumbered}
After the huge effort for process all the data, we implemented different machine learning methods. The development of the methods is focused on the assumption of particular scenarios as considered above.\ Systematic methods for the detection of suspected safety problems from spontaneous reports have been studied and practically implemented @doi:10.1001/archinte.167.10.1041. For example, the FDA currently adopts a data mining algorithm called multi-item gamma Poisson shrinker (MGPS) @15460169 for detecting potential signals from its spontaneous reports. Another important signal detection strategy is known as the Bayesian confidence propagation neural network (BCPNN) that has been used by the Uppsala Monitoring Center in routine pharmacovigilance with its World Health Organization database @15073883. Both this algorithm present pros and constraints and no method solved completely the problem till now. Our work is focused on the use of Artificial Neural Networks (NN) since they have the potentiality to handle the challenges faced by this problem.
Artificial Neural Networks {#artificial-neural-networks .unnumbered}
As discussed in literacy review: Neural Network (NN) is one of the methods well suited for studying Drug-ADR interaction.\ Previous works on Drug-ADR interaction focused mainly on Bayesian Neural Network (BNN) since Bayesian networks can easily represent continuous values and it can represent the correlation and independence of many variables, in this case many drugs or many ADRs. In fact, in BNN the links represent conditional relationships in the probabilistic sense. The generic Neural networks, generally speaking, have no such direct interpretation, and the intermediate nodes of most neural networks are discovered features, instead of having any predicate associated with them in their own right.\ The main two problems in pharmacovigilance are related to the nature of the adverse events and the interaction between Drugs and ADRs. Adverse event are situations in which there is a reaction after the use of a drugs. A naïve system can be constituted by a threshold of the number of adverse events reported. Unfortunately this system will lead to many false positive ADRs. If it’s secure to have many false positive from a pharmacovigilance prospective is not feasible when we want to design a machine that relieve the physicians to check many drugs. Many routine operations can lead to more errors.\ False positive is a problem that affect whatever implementation in pharmacovigilance.\ Another problem is called co-medication. When a subject has many ADRs and is medicated by many drugs can be hard to understand which drug cause which ADR. For this kind of problem a method like BCPNN or simply a BNN is likely to be needed because it can model the relation between many drugs and many ADRs.\ The focus of our experiments is the analysis with just one drug and one ADR so we don’t really need a BNN, however we’ll make some test comparing it with the usual FNN. Another assumption that we make is about the outcomes. As state before, we pose the problem as a classification problem rather that a regression problem, in particular we want to classify if a quarter ($4$ months data from AERS table) can be affected or not by an ADR for a given drug. We’ll describe more details later, now let’s introduce the two algorithms used for this project: Feedforward Neural Network (FNN) and Bayesian Neural Network (BNN)
FNN {#fnn .unnumbered}
The FNN used is composed by a classical sigmoid function. The number of layer is $3$, and the number of nodes was variable depending of the experiment and scenario considered. There are different techniques to learn the network, we used the Resilient BackPropagation.
Feedforward Neural Network with Resilient BackPropagation (Rprop)
The essential purpose of traditional BackPropagation (BP) algorithm is to approach the real output to the expected output value infinity; and the weight-update is based on the decrease of error function. One neuron has simple processing ability; many neurons will have compound function. So BP network has complex non-linear mapping ability and processing efficiency for many problems. But there also exists some disadvantages such as slow learning speed, convergence problem and getting trapped in local minima. To overcome these shortcomings, a number of faster training algorithms have been developed, including the RPROP (Resilient backPROPagation).\ RPROP is a representative method and is an adaptive learning algorithm. Its principle is to eliminate weight-step influence made by partial derivative. The sign of derivative is considered the direction of weight-update. All of these confirm that RPROP has prominence in convergence speed, stability and robustness.
BNN {#bnn .unnumbered}
The Bayesian Network is a machine learning method that is based on probability, and particularly Bayes’ Rule.\ A Bayesian Network is very different than a neural network, despite the fact that they are both types of “network”. Some of the important differences are summarized here.
-
Bayesian Networks are Discrete, Neural Networks are usually Continuous.
-
Bayesian Networks Provide a Probability of their output being true, Neural Networks give no such confidence measure.
-
Bayesian Networks can handle incomplete input just fine, most neural networks do not handle missing data.
-
Bayesian Networks do not have well defined inputs and outputs, neural network inputs and outputs must be well defined.
A Bayesian Network is made up of random variables and the probabilities between them. The probability of the events occurring depend on the probabilities of the other random variables occurring. The K2 training algorithm @Cooper:1992:BMI:145254.145259 is used to create the probability tables for the BNN. More details will be given later on the experiment section.
Encog Workbench: Java Neural Network Analyzer
Create a NN , learn it, test it and restructure it can be a long process. This tool simplify all the step making working with Neural Network a much more fun task. However, meanwhile the execution and design of the experiments I found some drawback. Sometimes you cannot just try to learn blindly a Network, the analysis of the inputs and output files has to be carefully analyzed to avoid trivial mistakes. Luckily this tool provide different way to test the execution of the different part, and at occurrence make some manual step to be sure of the good outcome. It provide different tools to save the configuration and export in other format as the BIF format, used for the representation of BNN.
Scenarios {#scenarios .unnumbered}
As we introduced above we’ll restrict our experiment to two main scenarios. Usually other on Drug-ADR interaction try to find the correlation between all the drug that appear on the AERS data and the adverse reactions tabulated by the MedDRA dictionary. This kind of problem is very complex and not easy to handle (thousand of drugs, thousand of ADRs!!).\ Since we have a limited list of BBWs $FDABBW$ (see table [table:fdabbwtable]) we address our goal as classification problem.\ We build two scenarios:
-
In the first scenario the positive data are composed of the instances of the AERS table in the quarter when has been issued a BBW for the given DRUG-ADR (a drug can have multiple BBWs, so we select the instances from the AERS table with the specific pair DRUG-ADR as in table [table:fdabbwtable]). The negative data are artificially generated as described above, we call “crossovered data”. Each instance contains $11$ features as described above and the classification is positive $(1)$ or negative $(0)$. The positive instance data is relative to the quarter when has been issued the Black Box Warning (BBW) . The negative data are artificially generated since the AERS database don’t contain negative data. The features used for this experiment are described in table [table:features11]. As we explain we use all or just $4$ of those. For this experiment we used a total of $100$ positive instances, and $100$ negative instances.\
-
The second scenario is still a classification problem, but time we use a different features set. The features set is composed of $39$ features as we can see in table [table:features39]. The difference from the first scenario is the addition of weekly signals (DE,LT,HO,DS,CA,RI,OT) related to the outcome of the AERS event when the seriousness of the instance is “ON”. The knowledge of these signal can lead at different techniques to classify the adverse records.
|p15cm|
**: Number of times that drug (signified by ID) occurs in AERS table before blackbox warning.\
**: Number of times that ADR (signified by ID) occurs in AERS table before blackbox warning.\
**: Number of times that drug and ADR (signified by ID) occur together in AERS table before blackbox warning.\
**: Number of times that AERS_NUM_DRUG_ADR instances are labeled with a SERIOUSNESS code != “OT” (other).\
**: Let drug (ADR) signal be the sum of all drug (ADR) signals from Google Trends. This feature is the Pearson correlation between the entire drug signal and the entire ADR signal.\
**: The maximum Pearson correlation between DELTA weeks of drug and ADR signal.\
**: The next maximum correlation of TRENDS_MAX1_DELTA_WEEK_PEARSON_CORRELATION.\
**: The next maximum correlation of TRENDS_MAX2_DELTA_WEEK_PEARSON_CORRELATION.\
**: Count of the number of simultaneous peaks over GAMMA weeks between drug and ADR signals.\
**: Count of the number of simultaneous increases in slope over GAMMA weeks between drug and ADR signals.\
**: Count of the number of hot trend searches between both a drug and ADR, as specified by the ID.\
|p15cm|
**: Number of times that drug (signified by ID) occurs in AERS table before blackbox warning.\
**: Number of times that ADR (signified by ID) occurs in AERS table before blackbox warning.\
**: Number of times that drug and ADR (signified by ID) occur together in AERS table before blackbox warning.\
**: Number of times that AERS_NUM_DRUG_ADR instances are labeled with a SERIOUSNESS code != “OT” (other).\
**: Weekly signal for AERS_NUM_DRUG_ADR_SERIOUS cases with “DE” death seriousness code (death) for the year before the blackbox warning.\
**: Considers “LT” seriousness code (life-threatening).\
**: Considers “HO” seriousness code (hospitalization).\
**: Considers “DS” seriousness code (disability).\
**: Considers “CA” seriousness code (congenital anomaly).\
**: Considers “RI” seriousness code (required intervention to prevent permanent impairment/damage).\
**: Considers “OT” seriousness code (other).\
**: Respective cumulative signal.\
**: Respective cumulative signal.\
**: Respective cumulative signal.\
**: Respective cumulative signal.\
**: Respective cumulative signal.\
**: Respective cumulative signal.\
**: Respective cumulative signal.\
**: Weekly signal for AERS_NUM_DRUG_ADR_SERIOUS cases with “DE” seriousness code (death) for the year after the blackbox warning.\
**: Considers “LT” seriousness code (life-threatening).\
**: Considers “HO” seriousness code (hospitalization).\
**: Considers “DS” seriousness code (disability).\
**: Considers “CA” seriousness code (congenital anomaly).\
**: Considers “RI” seriousness code (required intervention to prevent permanent impairment/damage).\
**: Considers “OT” seriousness code (other).\
**: Respective cumulative signal.\
**: Respective cumulative signal.\
**: Respective cumulative signal.\
**: Respective cumulative signal.\
**: Respective cumulative signal.\
**: Respective cumulative signal.\
**: Respective cumulative signal.\
**: Let drug (ADR) signal be the sum of all drug (ADR) signals from Google Trends.\
**: The maximum Pearson correlation between DELTA weeks of drug and ADR signal.\
**: The next maximum correlation of TRENDS_MAX1_DELTA_WEEK_PEARSON_CORRELATION.\
**: The next maximum correlation of TRENDS_MAX2_DELTA_WEEK_PEARSON_CORRELATION.\
**: Count of the number of simultaneous peaks over GAMMA weeks between drug and ADR signals.\
**: Count of the number of simultaneous increases in slope over GAMMA weeks between drug and ADR signals.\
**: Count of the number of hot trend searches between both a drug and ADR, as specified by the ID.\
Scenario 1 {#scenario-1 .unnumbered}
Experiment 1 FNN
The first test is conducted using a FNN using all the $11$ features as in table [table:features11]. The network is learned using the RPROP methology.

In figure [fig:errexp1] is reported the training error for the NN. In figure [fig:net1] the network configuration and the activation function used.

As we can see from figure [fig:errexp1] the NN is learned with just $132$ training iterations and the training error is below $1 \%$ $( 0.01 \%)$ since we pose $1 \%$ as the target error. However results like this on data so troublesome like the AERS data follow by very common well known phenomena: OVERFITTING. In fact computing the error rate on the test set ($25 \%$ of the total instances) we have the bad news that the error is around $38 \%$.\ The conclusion for this first experiment is that using all the $11$ features to classify these instances is cause of overfitting. A good solution can be the use of more data and we’ll see the effect in a another scenario, but to have a solution feasible for this scenario (we have a limited ground true data!) we change the features set that we use.\ The second part of the experiment is to change the features used in a way to avoid overfitting. We modify the features selected using only $5$ features. We keep $2$ features previously considered and and $3$ new features combining some of the remaining from the $11$ features table.
Experiment 2 FNN
With these input we learned a new network. In figure [fig:exp2] we can see the training error with this features set is a bit higher than before (in this case we set the target error at $10$). Also after $35000$ iteration is still more than $14 \%$. But analyzing the error rate on the test set we obtain only $23 \%$. Definitely using just $5$ features is a more reliable value.

In figures [fig:net2] and [fig:schema2] we can see the new network configuration. The overfitting is the phenomena where the classifier perform better on the training set than the set set. One of the side effect is the perfect fitting on the training data, overspecializing the classifier. From the side of complexity a network that overfit the data will look more complex and specific. This effect can be seen in figures [fig:net2] and [fig:schema2]. The new NN is more simpler and it perform better on the test data.


Varying the size of training and test set we get the following results (table [tab:exp2]):
% training/test Error Rate test Error Rate Training —————– —————– ——————— $75 \% / 25 \%$ $23 \%$ $14 \%$ $50 \% / 50 \%$ $41,2 \%$ $ 10 \%$ $25 \% / 75 \%$ $41.1 \%$ $ 9 \%$
Experiment with Bayesian Network BNN {#experiment-with-bayesian-network-bnn .unnumbered}
The Bayesian Neural Network as said before is best suited for DRUG ADR interaction @8823623. In this scenario the BNN it cannot be the ideal choice, however we report some experiment to compare the performances with the previous method.
Experiment 1 BNN
We reply the scenario in the above experiment $1$. in this case we get $0 \%$ of error in training set and $3.8 \%$ on the test set, in table [tab:exp1_bayes]. there are other results for this experiment. The BNN is make by random variables. You can see the random variables in the graph of figure [fig:exp1_ba].

% training/test Error Rate test Error Rate Training —————– —————– ——————— $75 \% / 25 \%$ $0.01 \%$ $3.8 \%$ $50 \% / 50 \%$ $0.01 \%$ $ 4.5 \%$ $25 \% / 75 \%$ $0.01 \%$ $ 15 \%$
The random variables are the $11$ features in table [table:features11]. You will notice that the TYPE_OF_EXAMPLE (our goal function) is dependent from all the other variables. The probability of the events occurring depend on the probabilities of the other random variables occurring. The complete probability of this network can be written as follows:
The most important parts about the BNN are the truth tables. The truth tables give the probabilities of each of the events occurring. The truth tables are somewhat comparable to neural network weights. However, the truth tables are actually human readable instead NN weights usually have no meaning to humans, and thus the neural network is a black box. For space issue we report the extensive list of true tables in appendix [app:BNN_TT].
Experiment 2 BNN
In this experiment we replied the experiment $2$ with the BNN. Contrarily to the respective FNN case , using a BNN with this data lower the performances. As we can see from the figure [fig:exp2_bay] both training and testing get lower results. However this results are more certain and they’re not affected by overfitting.

size training/test Error Rate test Error Rate Training $75 \% / 25 \%$ $38.4 \%$ $27.63 \%$ ——————– —————– ———————
The complete probability of this network is
The true tables for this experiment can be seen in appendix [app:BNN_TT2].
Scenario 2 {#scenario-2 .unnumbered}
More experiments has been conducted on different data. This time we want to use some useful features about the AERS dataset. For each event on the AERS dataset there is a field about the seriousness of the event and, in particular, if the event has this flag on there are a set of indicator that address the outcome of the event (Hospitalization, death, etc..). A better precise explanation of this flags can be see found above. The importance of this information is soon explained: a higher rate of hospitalization or death connected with a specified drug can lead with high probability to a Black Box Warning.\ The new features form a vector with the event outcome (HOspitalization, ri, death, ……) and with the actual sum of the number of event until that moment. Another change to the features set is the new format of the data. In the previous experiments we collect just one instance for each quarter (when the BBW was issued). This time we want to analyze the evolution over time of the events. To do so we collect the information over $48$ weeks in different times. In particular we have the $48$ weeks of the quarter when the BBW was issued and denote this as positive. We assume that $15$ months before there is no record indicating a possible BBW. Then we denote the $48$ weeks before as negative. We repeat the analysis picking up the data $15$ months after the BBW and we denote this data as positive. For each week the features are extended with the new flags, plus each flag has a respective counter that keep record of the sum of the events with that specific outcome. These supplemental field has been introduced since the NN cannot keep record of past values, so it needs a buffer to store that information.\
Experiment 3 FNN
In this experiment we use $39$ features as shown in table [table:features39].\ The setting is still the same: FNN learned with Resilient BackPropagation (RPROP) algorithm. The default values for training and testing is still $75 \% / 25 \%$ and the target error is fixed at $10 \%$. We get the training error as $9.6 \%$ and the test error $1.7 \%$. This experiment is executed using $222$ instances: $120$ positive and $102$ negative. For the negative data we use the artificially created data as explained above. The good error rate on the test set make it sure that we don’t have overfitting problems. The other data for this experiment are reported in the figures [fig:exp3_data], [fig:exp3_diag]. [fig:weights_exp3].


size training/test Error Rate test Error Rate Training $75 \% / 25 \%$ $1.7 \%$ $9.6 \%$ $50 \% / 50 \%$ $2.1 \%$ $ 5.21 \%$ $25 \% / 75 \%$ $3.5\%$ $ 7.1 \%$ ——————– —————– ———————
As we can from figure [fig:exp3_errors] the behavior of this experiment is sometimes odd. For the default values of $75 \% / 25 \%$ the results are normal and the network learn and obtain good result on the test set. However, sometimes the algorithm doesn’t converge. Since we randomly pick the training data, it can be that for some sequence the algorithm cannot assure the convergence. We will explain later a possible explanation to this behavior.
Experiment 4 FNN
In this setting we replied the previous experiment using a different data. In the previous experiment we use artificially generated negative instances. In this case we use the instances of $15$ months before the BBW date. We assume that $15$ months is a time sufficient “apart” to don’t have yet some kind of pattern typical for the ADRs, but there is still some correlation with that drug. I fact one of the problem in detecting a BBW is the presence of false positive. If the assumption if correct we should be able to have performances similar to the previous experiment.\ With this settings we try to learn a FNN with the above methology but unfortunately the network cannot learn well and the training error is always very high.\ Then, the data $15$ months before cannot be considered negative and independent from the positive data (instances on the BBW quarter.) The partially learned network obtained a worst performance of $50 \%$ in Error Rate.\
Experiment 5 FNN: only the weekly signals
At this point we want to check the reliability of the so called weekly signals (de,lt,ho,ds,ca,ri,ot). We use the same positive data (instance on the quarter of the BBW) and negative data (artificially created). Surprisingly, the training error is almost the same $20 \%$ and the error on the test set is much better $6.8 \%$. This result is to analyze further and understand if we are in presence of overfitting.


% training/test Error Rate test Error Rate Training —————– —————– ——————— $75 \% / 25 \%$ $6.8 \%$ $20 \%$ $50 \% / 50 \%$ $25 \%$ $ 45 \%$ $25 \% / 75 \%$ $40 \%$ $ 57 \%$
Experiment 3 BNN
This experiment reply the setup of experiment 3 FNN using a Bayesian NN. Surprisingly we get $7.1 \% $ error in the test set and the training error is $0.60 \%$. in figure [fig:exp3b_diag] we can see the diagram of this network. Other interesting results are in table [tab:exp3_bayes].

% training/test Error Rate test Error Rate Training —————– —————– ——————— $75 \% / 25 \%$ $7.1 \%$ $0.60 \%$ $50 \% / 50 \%$ $12.5 \%$ $ 3 \%$ $25 \% / 75 \%$ $18.6 \%$ $ 3.57 \%$
The complete probability of this network and the true table are reported in appendix
Supplemental experiments {#supplemental-experiments .unnumbered}
Deng Cao’ work {#deng-cao-work .unnumbered}
Outline
This report is organized as follows. Section [NN] briefly describes the formulation of the proposed neural network. Another classifier, support vector machine, is introduced for performance comparison in Section [SVM]. The experimental results are presented in Section [experiments]. Finally, Section [discussion] gives some extended discussion.
Formulation of Neural Network {#NN .unnumbered}
Our work is to implement a multi-layer feed-forward neural network classifier that is described in textbook @Mitchell:1997. A Matlab neural network GUI (command: nnstart) is used to build the network. The structure of the network is described as follows.
-
Input and Output. We consider 11 attributes(features) so the number of input units is 11. All the features are presented in real numbers. For the final output, we assume two possible outcomes $y=1$ and $y=0$.
-
Hidden units. A single hidden layer might be good enough in our case since we do not have many inputs. A suggested total number of hidden units could be $\sqrt{mk}$, where $m$ is the number of input units and $k$ is the number of final output units. Here, since we have 11 attributes and 2 final outputs, the number of hidden layers is set to be 5.
-
Normalization. We normalize our data (both training and test data) in range $[0,1]$. This is a simple way to prevent extrapolation.
-
Sigmoid function In our standard Neural Network, we compute the weighted sum via $net=\sum_{i=0}^{m}w_{i}x_{i}$. It might be important to apply a differentiable activation function $g$ to $net$, since we do not have prior knowledge whether the data is linearly separable. Here we use hyperbolic tangent sigmoid function:
-
Back Propagation A scaled conjugate gradient back propagation algorithm is then applied.
Formulation of Support Vector Machine {#SVM .unnumbered}
A support vector machine (SVM) classifier is is also implemented to compare the performance. A detailed introduction of SVM can be find in @Cortes:1995. There are a number of public SVM tools can be found via web search. In this work we use LIBSVM @libsvm, which is a popular library for SVM. The original program is in C/C++, but it also has a Matlab interface. The formulation is described as follows.
-
Normalization. We normalize our feature data (both training and test data) in range $[0,1]$.
-
Classifier. A $C$-support vector classifier ($C$-SVC) is applied. Given training vectors $x_{i} \in R^{n}$ and output $y \in [-1,1]$, $C$-SVC solves the primal optimization problem: subject to $y_{i}(w^{T}\phi(x_{i}+b))\geq 1-s_{i}$ and $s_{i}>0$, where $\phi(x_{i})$ maps $x_{i}$ into a higher-dimensional space and $C>0$ is the regularization parameter.
-
Kernel Function. A radial basis function(RBF) (Eqn [eqn:rbf]) is used as the primary kernel: where $\gamma$ is the width of the basis function.
Experiments {#experiments .unnumbered}
Results Based on Neural Network {#results-based-on-neural-network .unnumbered}
As previous mentioned, we first build a neural network with one hidden layer and 5 hidden units (Fig. [fig:NN]). The data we used here contains 120 positive instances and 102 negative instances, and 11 features as total. 50% of the data is randomly selected for training, 15% is used for validation and the remaining 35% is used for test. For 11 features, we have above 40% misclassification rate, and the misclassification rate is not stable (vary from 40% to 60%). In a second trial, we select 4 out of 11 features and send them to the same network. And the results are very similar to the results in the previous trial (See Fig. [fig:NN2] for an example).

[htp]
Results Based on SVM {#results-based-on-svm .unnumbered}
Now we apply SVM on the same database. A leave-K-out strategy is considered, which involves using $K$ random samples from the original data as the test data, and the remaining samples as the training data. In particular, we leave out approximately 35% data for the test, and the rest data is for the training. We use ($C=128,\gamma=1$) as kernel parameters (The parameters are selected based on experimental results). The experiment is repeated 100 times with replacement and the average performance is reported. For 11 features we have a 41.6% average misclassification rate. For 4 features we use ($C=256,\gamma=0.0313$) and have a 42.5% average misclassification rate. Compared with neural network, the SVM classifier yields more stable results. The outcome is slightly affected by the the reduced number of features. This might imply that the other 7 features are redundant.
Zachary William’ work {#zachary-william-work .unnumbered}
KNN {#knn .unnumbered}
The k-nearest neighbor classifier classifies a testing example by comparing that example to each of the training example and reporting back what type of training example is closest to the testing example. The dataset we have was split into two parts for training and testing, with $75 \%$ of the available data doing to testing the classifier and the remaining $25 \%$ used for training the classifier. The k-nearest neighbor was tested with k=1 and 3. Using k=3 produced inferior results to those from testing with k=1. A testing example was classified using k=3 based on what group was most common among the three closest neighbors. Initially testing made use of all variables but a later iteration of the program had the option to select what variables to use from the data. Changing the variables used had no noticeable impact on the classifier.\ Training the classifier is done by separating all of the data available into one of two sets, either training or testing. The training set is used later for classifying the examples from the testing set. No formal training occurs in this classifier, the classifier works by comparing each individual in the testing set with those in the training set. A score between two examples is found by using the Euclidean distance. Whichever training example produces the lowest score is what the training example is classified as.\ Our project produced two separate data sets for use in the project. The k-nearest neighbor classifier made use of the first data set. There was a perceived bias in the first data set towards positive training examples but in testing the positive training examples were those more likely to have errors so we can assume that this bias does not effect this classifier. Removing a few features resulted in minimal loss of classification rate so we chose to just use all 11 available features in the data set. The next stage of the k-nearest neighbor classifier was to test the classifier with varying amounts of training and testing data. Initially this was a set value but a varying percentage shows how the system works based on how much training data is available. Testing showed that a larger training set results in better results for the k-nearest neighbor classifier.\ \ KNN:
-
K=1 $80 \%$
-
k=3 $60 \%$

Future Research {#future-research .unnumbered}
In this work, we consider drugs and adverse reactions (ADRs) that are documented to have a blackbox warning date issued by the FDA. The machine learning problem that we formulate is a decision problem suitable for classification. The problem is: does AERS data and Google Trends data detect a blackbox warning before data with a timestamp $t$? In our case, we set $t$ to one quarter before the blackbox warning. By analyzing data up until $t$, we ensure that only the available data at the time of the blackbox warning is examined. We can further extend this decision problem to (1) determine the anticipated date of a blackbox warning and (2) identify the existence of currently unreported blackbox warnings.
As a future research problem, we acknowledge that a more involved problem is to determine the actual date in which the blackbox warning occurs. Let $d_s$ be the first date that we consider. Our algorithm, in a programmatic form, behaves in the following way: $b=\texttt{classify}(D,A,d_s,d_e)$, where $b=$true if features from AERS and Google Trends tables detect if the blackbox warning between drug $D$ and ADR $A$ occurs during the date range $[d_s,d_e]$ and $b=$false otherwise. In Listing [algorithm:predictBBWdate], we identify the algorithm $\texttt{predictBBWdate}$ to determine the date in which a blackbox warning occurs between drug $D$ and ADR $A$ in the date range $[start,current]$, where $start$ is the earliest date considered and $current$ is the current date. The algorithm uses the aforementioned function $\texttt{classify}$ in a binary-search-esque manner to pinpoint the appropriate date for the blackbox warning, using the operations $>_d$, $+_d$, $-_d$, and $\texttt{middate}$, which respectively denote the chronological relationship between dates, adds months to a date, subtracts months from a date, and returns the middle date given two dates. In the case that we want to find out if a new drug ${D}’$ should have an ADR ${A}’$ after start date ${S}’$, we can use $T’=\texttt{predictBBWdate}({D}’,{A}’,{S}’)$ to detect both when and if the blackbox warning should have occurred. That is, when $T’\neq(0,0)$ the system predicts a blackbox warning at month $T’.mm$ of year $T’.yyyy$. Otherwise, the system predicts that no blackbox warning is required.
Other ways to extend our results include adding mechanisms and guards to differentiate a drug and an ADR from ADRs that are the result of drug-to-drug combinations. This problem is much more difficult since the notion of handling pairwise drugs is a combinatorial problem. Also, we can extend the idea of strictly detecting blackbox warnings to also distinguish between various categories of the lifecycle of a drug: medication review, recall from shelves, withdrawal from market, and obviously the application of a blackbox warning. It will be challenging to distinguish the different categories from the signals since more signals will be needed from varying media. However, it is advantagous to study this problem since the results will be trained for specific categories and thus, removing noise from blackbox warning detection since a medical review period might improperly classify a drug and some ADR “scare”. We also note that by using Google Trends data in this work, we avoided a much larger data mining problem of crawling the web and analyzing raw data programmatically using a sentiment analysis. By directly handling web data, we can produce a library of knowledge and more easily generate alternative signals for analysis to address future research questions.
struct BBWdate { int $mm$, int $yyyy$ }

BBWdate $\texttt{predictBBWdate}$(Drug $D$, ADR $A$, BBWdate $start$){
    BBWdate $end$=($\texttt{current\_mm}$(),$\texttt{current\_yyyy}$()), $mid$=(0,0), $found$=(0,0)
    boolean $occur$=false
    while($end$$\:>_d\:$$start$){
        $mid$=$\texttt{middate}$($start$,$end$)
        $occur$=$\texttt{classify}$($D$,$A$,$start$,$mid$)
        if($occur$){ /* We found BBW at mid! Can we detect BBW earlier? */
            $found$=$mid$
            $max$=$mid$$\:-_d\:$$1$
        }else{ /* BBW was not found! Try searching with later date. */
            $mid$=$start$$\:+_d\:$$1$
        }
    }
    return found
}
Experiment 1 BNN: True Tables
We report here all the conditional probabilities that define a BNN. This
P(id=0|+type_of_example)=0.9512195121951219
P(id=1|+type_of_example)=0.3333333333333333
P(id=2|+type_of_example)=0.024390243902439025
P(id=0|-type_of_example)=0.024390243902439025
P(id=1|-type_of_example)=0.3333333333333333
P(id=2|-type_of_example)=0.9512195121951219
P(+type_of_example|id=Type0)=0.975
P(-type_of_example|id=Type0)=0.025
P(+type_of_example|id=Type1)=0.025
P(-type_of_example|id=Type1)=0.025
P(+type_of_example|id=Type2)=0.025
P(-type_of_example|id=Type2)=0.975
P(aers_num_drug=0|+type_of_example)=0.4714285714285714
P(aers_num_drug=1|+type_of_example)=0.6666666666666666
P(aers_num_drug=2|+type_of_example)=0.3333333333333333
P(aers_num_drug=0|-type_of_example)=0.5142857142857142
P(aers_num_drug=1|-type_of_example)=0.2222222222222222
P(aers_num_drug=2|-type_of_example)=0.5
P(aers_num_adr=0|+type_of_example)=0.05555555555555555
P(aers_num_adr=1|+type_of_example)=0.05714285714285714
P(aers_num_adr=2|+type_of_example)=0.02857142857142857
P(aers_num_adr=3|+type_of_example)=0.029411764705882353
P(aers_num_adr=4|+type_of_example)=0.030303030303030304
P(aers_num_adr=5|+type_of_example)=0.05714285714285714
P(aers_num_adr=6|+type_of_example)=0.05714285714285714
P(aers_num_adr=7|+type_of_example)=0.08571428571428572
P(aers_num_adr=8|+type_of_example)=0.029411764705882353
P(aers_num_adr=9|+type_of_example)=0.029411764705882353
P(aers_num_adr=10|+type_of_example)=0.05714285714285714
P(aers_num_adr=11|+type_of_example)=0.029411764705882353
P(aers_num_adr=12|+type_of_example)=0.05555555555555555
P(aers_num_adr=13|+type_of_example)=0.08108108108108109
P(aers_num_adr=14|+type_of_example)=0.030303030303030304
P(aers_num_adr=15|+type_of_example)=0.11627906976744186
P(aers_num_adr=16|+type_of_example)=0.05714285714285714
P(aers_num_adr=17|+type_of_example)=0.029411764705882353
P(aers_num_adr=18|+type_of_example)=0.1111111111111111
P(aers_num_adr=19|+type_of_example)=0.029411764705882353
P(aers_num_adr=20|+type_of_example)=0.08333333333333333
P(aers_num_adr=21|+type_of_example)=0.1111111111111111
P(aers_num_adr=22|+type_of_example)=0.030303030303030304
P(aers_num_adr=23|+type_of_example)=0.05405405405405406
P(aers_num_adr=24|+type_of_example)=0.029411764705882353
P(aers_num_adr=25|+type_of_example)=0.08333333333333333
P(aers_num_adr=26|+type_of_example)=0.029411764705882353
P(aers_num_adr=27|+type_of_example)=0.05714285714285714
P(aers_num_adr=28|+type_of_example)=0.05714285714285714
P(aers_num_adr=29|+type_of_example)=0.10810810810810811
P(aers_num_adr=30|+type_of_example)=0.08333333333333333
P(aers_num_adr=31|+type_of_example)=0.10810810810810811
P(aers_num_adr=32|+type_of_example)=0.08333333333333333
P(aers_num_adr=0|-type_of_example)=0.08333333333333333
P(aers_num_adr=1|-type_of_example)=0.05714285714285714
P(aers_num_adr=2|-type_of_example)=0.08571428571428572
P(aers_num_adr=3|-type_of_example)=0.058823529411764705
P(aers_num_adr=4|-type_of_example)=0.030303030303030304
P(aers_num_adr=5|-type_of_example)=0.05714285714285714
P(aers_num_adr=6|-type_of_example)=0.05714285714285714
P(aers_num_adr=7|-type_of_example)=0.02857142857142857
P(aers_num_adr=8|-type_of_example)=0.058823529411764705
P(aers_num_adr=9|-type_of_example)=0.058823529411764705
P(aers_num_adr=10|-type_of_example)=0.05714285714285714
P(aers_num_adr=11|-type_of_example)=0.058823529411764705
P(aers_num_adr=12|-type_of_example)=0.08333333333333333
P(aers_num_adr=13|-type_of_example)=0.08108108108108109
P(aers_num_adr=14|-type_of_example)=0.030303030303030304
P(aers_num_adr=15|-type_of_example)=0.16279069767441862
P(aers_num_adr=16|-type_of_example)=0.05714285714285714
P(aers_num_adr=17|-type_of_example)=0.058823529411764705
P(aers_num_adr=18|-type_of_example)=0.027777777777777776
P(aers_num_adr=19|-type_of_example)=0.058823529411764705
P(aers_num_adr=20|-type_of_example)=0.05555555555555555
P(aers_num_adr=21|-type_of_example)=0.027777777777777776
P(aers_num_adr=22|-type_of_example)=0.030303030303030304
P(aers_num_adr=23|-type_of_example)=0.10810810810810811
P(aers_num_adr=24|-type_of_example)=0.058823529411764705
P(aers_num_adr=25|-type_of_example)=0.05555555555555555
P(aers_num_adr=26|-type_of_example)=0.058823529411764705
P(aers_num_adr=27|-type_of_example)=0.05714285714285714
P(aers_num_adr=28|-type_of_example)=0.05714285714285714
P(aers_num_adr=29|-type_of_example)=0.05405405405405406
P(aers_num_adr=30|-type_of_example)=0.05555555555555555
P(aers_num_adr=31|-type_of_example)=0.05405405405405406
P(aers_num_adr=32|-type_of_example)=0.05555555555555555
P(aers_num_drug_adr=0|+type_of_example)=0.5066666666666667
P(aers_num_drug_adr=1|+type_of_example)=0.3333333333333333
P(aers_num_drug_adr=2|+type_of_example)=0.2857142857142857
P(aers_num_drug_adr=0|-type_of_example)=0.48
P(aers_num_drug_adr=1|-type_of_example)=0.3333333333333333
P(aers_num_drug_adr=2|-type_of_example)=0.5714285714285714
P(aers_num_drug_adr_serious=0|+type_of_example)=0.5066666666666667
P(aers_num_drug_adr_serious=1|+type_of_example)=0.25
P(aers_num_drug_adr_serious=2|+type_of_example)=0.3333333333333333
P(aers_num_drug_adr_serious=0|-type_of_example)=0.48
P(aers_num_drug_adr_serious=1|-type_of_example)=0.5
P(aers_num_drug_adr_serious=2|-type_of_example)=0.5
P(trends_drug_adr_search_pearson_correlation=0|+type_of_example)=0.3333333333333333
P(trends_drug_adr_search_pearson_correlation=1|+type_of_example)=0.5283018867924528
P(trends_drug_adr_search_pearson_correlation=2|+type_of_example)=0.45
P(trends_drug_adr_search_pearson_correlation=0|-type_of_example)=0.5833333333333334
P(trends_drug_adr_search_pearson_correlation=1|-type_of_example)=0.4528301886792453
P(trends_drug_adr_search_pearson_correlation=2|-type_of_example)=0.5
P(trends_max3_delta_week_pearson_correlation=0|+type_of_example)=0.5882352941176471
P(trends_max3_delta_week_pearson_correlation=1|+type_of_example)=0.47058823529411764
P(trends_max3_delta_week_pearson_correlation=2|+type_of_example)=0.45098039215686275
P(trends_max3_delta_week_pearson_correlation=0|-type_of_example)=0.35294117647058826
P(trends_max3_delta_week_pearson_correlation=1|-type_of_example)=0.47058823529411764
P(trends_max3_delta_week_pearson_correlation=2|-type_of_example)=0.5294117647058824
P(trends_max2_delta_week_pearson_correlation=0|+type_of_example)=0.625
P(trends_max2_delta_week_pearson_correlation=1|+type_of_example)=0.4375
P(trends_max2_delta_week_pearson_correlation=2|+type_of_example)=0.4528301886792453
P(trends_max2_delta_week_pearson_correlation=0|-type_of_example)=0.3125
P(trends_max2_delta_week_pearson_correlation=1|-type_of_example)=0.5
P(trends_max2_delta_week_pearson_correlation=2|-type_of_example)=0.5283018867924528
P(trends_max1_delta_week_pearson_correlation=0|+type_of_example)=0.6
P(trends_max1_delta_week_pearson_correlation=1|+type_of_example)=0.42857142857142855
P(trends_max1_delta_week_pearson_correlation=2|+type_of_example)=0.4642857142857143
P(trends_max1_delta_week_pearson_correlation=0|-type_of_example)=0.3333333333333333
P(trends_max1_delta_week_pearson_correlation=1|-type_of_example)=0.5
P(trends_max1_delta_week_pearson_correlation=2|-type_of_example)=0.5178571428571429
P(trends_count_gamma_week_peaks=0|+type_of_example)=0.16
P(trends_count_gamma_week_peaks=1|+type_of_example)=0.1875
P(trends_count_gamma_week_peaks=2|+type_of_example)=0.13636363636363635
P(trends_count_gamma_week_peaks=3|+type_of_example)=0.22727272727272727
P(trends_count_gamma_week_peaks=4|+type_of_example)=0.10526315789473684
P(trends_count_gamma_week_peaks=5|+type_of_example)=0.10526315789473684
P(trends_count_gamma_week_peaks=6|+type_of_example)=0.05555555555555555
P(trends_count_gamma_week_peaks=7|+type_of_example)=0.047619047619047616
P(trends_count_gamma_week_peaks=8|+type_of_example)=0.10526315789473684
P(trends_count_gamma_week_peaks=9|+type_of_example)=0.10526315789473684
P(trends_count_gamma_week_peaks=10|+type_of_example)=0.19230769230769232
P(trends_count_gamma_week_peaks=11|+type_of_example)=0.2
P(trends_count_gamma_week_peaks=12|+type_of_example)=0.09523809523809523
P(trends_count_gamma_week_peaks=13|+type_of_example)=0.13043478260869565
P(trends_count_gamma_week_peaks=14|+type_of_example)=0.13636363636363635
P(trends_count_gamma_week_peaks=15|+type_of_example)=0.16
P(trends_count_gamma_week_peaks=16|+type_of_example)=0.19047619047619047
P(trends_count_gamma_week_peaks=17|+type_of_example)=0.09523809523809523
P(trends_count_gamma_week_peaks=0|-type_of_example)=0.2
P(trends_count_gamma_week_peaks=1|-type_of_example)=0.3125
P(trends_count_gamma_week_peaks=2|-type_of_example)=0.13636363636363635
P(trends_count_gamma_week_peaks=3|-type_of_example)=0.045454545454545456
P(trends_count_gamma_week_peaks=4|-type_of_example)=0.05263157894736842
P(trends_count_gamma_week_peaks=5|-type_of_example)=0.05263157894736842
P(trends_count_gamma_week_peaks=6|-type_of_example)=0.05555555555555555
P(trends_count_gamma_week_peaks=7|-type_of_example)=0.19047619047619047
P(trends_count_gamma_week_peaks=8|-type_of_example)=0.05263157894736842
P(trends_count_gamma_week_peaks=9|-type_of_example)=0.05263157894736842
P(trends_count_gamma_week_peaks=10|-type_of_example)=0.19230769230769232
P(trends_count_gamma_week_peaks=11|-type_of_example)=0.16
P(trends_count_gamma_week_peaks=12|-type_of_example)=0.14285714285714285
P(trends_count_gamma_week_peaks=13|-type_of_example)=0.17391304347826086
P(trends_count_gamma_week_peaks=14|-type_of_example)=0.13636363636363635
P(trends_count_gamma_week_peaks=15|-type_of_example)=0.2
P(trends_count_gamma_week_peaks=16|-type_of_example)=0.047619047619047616
P(trends_count_gamma_week_peaks=17|-type_of_example)=0.14285714285714285
P(trends_count_gamma_week_increased_slope=0|+type_of_example)=0.03571428571428571
P(trends_count_gamma_week_increased_slope=1|+type_of_example)=0.12903225806451613
P(trends_count_gamma_week_increased_slope=2|+type_of_example)=0.034482758620689655
P(trends_count_gamma_week_increased_slope=3|+type_of_example)=0.034482758620689655
P(trends_count_gamma_week_increased_slope=4|+type_of_example)=0.058823529411764705
P(trends_count_gamma_week_increased_slope=5|+type_of_example)=0.06451612903225806
P(trends_count_gamma_week_increased_slope=6|+type_of_example)=0.14705882352941177
P(trends_count_gamma_week_increased_slope=7|+type_of_example)=0.06451612903225806
P(trends_count_gamma_week_increased_slope=8|+type_of_example)=0.06896551724137931
P(trends_count_gamma_week_increased_slope=9|+type_of_example)=0.06896551724137931
P(trends_count_gamma_week_increased_slope=10|+type_of_example)=0.06666666666666667
P(trends_count_gamma_week_increased_slope=11|+type_of_example)=0.12121212121212122
P(trends_count_gamma_week_increased_slope=12|+type_of_example)=0.03333333333333333
P(trends_count_gamma_week_increased_slope=13|+type_of_example)=0.06896551724137931
P(trends_count_gamma_week_increased_slope=14|+type_of_example)=0.03333333333333333
P(trends_count_gamma_week_increased_slope=15|+type_of_example)=0.09375
P(trends_count_gamma_week_increased_slope=16|+type_of_example)=0.0625
P(trends_count_gamma_week_increased_slope=17|+type_of_example)=0.1
P(trends_count_gamma_week_increased_slope=18|+type_of_example)=0.12903225806451613
P(trends_count_gamma_week_increased_slope=19|+type_of_example)=0.06666666666666667
P(trends_count_gamma_week_increased_slope=20|+type_of_example)=0.06896551724137931
P(trends_count_gamma_week_increased_slope=21|+type_of_example)=0.03225806451612903
P(trends_count_gamma_week_increased_slope=22|+type_of_example)=0.15151515151515152
P(trends_count_gamma_week_increased_slope=23|+type_of_example)=0.034482758620689655
P(trends_count_gamma_week_increased_slope=24|+type_of_example)=0.06666666666666667
P(trends_count_gamma_week_increased_slope=25|+type_of_example)=0.09090909090909091
P(trends_count_gamma_week_increased_slope=26|+type_of_example)=0.12121212121212122
P(trends_count_gamma_week_increased_slope=27|+type_of_example)=0.06666666666666667
P(trends_count_gamma_week_increased_slope=0|-type_of_example)=0.03571428571428571
P(trends_count_gamma_week_increased_slope=1|-type_of_example)=0.03225806451612903
P(trends_count_gamma_week_increased_slope=2|-type_of_example)=0.06896551724137931
P(trends_count_gamma_week_increased_slope=3|-type_of_example)=0.06896551724137931
P(trends_count_gamma_week_increased_slope=4|-type_of_example)=0.17647058823529413
P(trends_count_gamma_week_increased_slope=5|-type_of_example)=0.0967741935483871
P(trends_count_gamma_week_increased_slope=6|-type_of_example)=0.08823529411764706
P(trends_count_gamma_week_increased_slope=7|-type_of_example)=0.0967741935483871
P(trends_count_gamma_week_increased_slope=8|-type_of_example)=0.034482758620689655
P(trends_count_gamma_week_increased_slope=9|-type_of_example)=0.034482758620689655
P(trends_count_gamma_week_increased_slope=10|-type_of_example)=0.06666666666666667
P(trends_count_gamma_week_increased_slope=11|-type_of_example)=0.09090909090909091
P(trends_count_gamma_week_increased_slope=12|-type_of_example)=0.1
P(trends_count_gamma_week_increased_slope=13|-type_of_example)=0.034482758620689655
P(trends_count_gamma_week_increased_slope=14|-type_of_example)=0.1
P(trends_count_gamma_week_increased_slope=15|-type_of_example)=0.09375
P(trends_count_gamma_week_increased_slope=16|-type_of_example)=0.125
P(trends_count_gamma_week_increased_slope=17|-type_of_example)=0.03333333333333333
P(trends_count_gamma_week_increased_slope=18|-type_of_example)=0.03225806451612903
P(trends_count_gamma_week_increased_slope=19|-type_of_example)=0.06666666666666667
P(trends_count_gamma_week_increased_slope=20|-type_of_example)=0.034482758620689655
P(trends_count_gamma_week_increased_slope=21|-type_of_example)=0.12903225806451613
P(trends_count_gamma_week_increased_slope=22|-type_of_example)=0.06060606060606061
P(trends_count_gamma_week_increased_slope=23|-type_of_example)=0.06896551724137931
P(trends_count_gamma_week_increased_slope=24|-type_of_example)=0.06666666666666667
P(trends_count_gamma_week_increased_slope=25|-type_of_example)=0.12121212121212122
P(trends_count_gamma_week_increased_slope=26|-type_of_example)=0.09090909090909091
P(trends_count_gamma_week_increased_slope=27|-type_of_example)=0.06666666666666667
P(trends_count_drug_adr_hot_results=0|+type_of_example)=0.5217391304347826
P(trends_count_drug_adr_hot_results=1|+type_of_example)=0.1
P(trends_count_drug_adr_hot_results=2|+type_of_example)=0.2222222222222222
P(trends_count_drug_adr_hot_results=3|+type_of_example)=0.1
P(trends_count_drug_adr_hot_results=4|+type_of_example)=0.2222222222222222
P(trends_count_drug_adr_hot_results=5|+type_of_example)=0.1
P(trends_count_drug_adr_hot_results=6|+type_of_example)=0.18181818181818182
P(trends_count_drug_adr_hot_results=7|+type_of_example)=0.08333333333333333
P(trends_count_drug_adr_hot_results=0|-type_of_example)=0.391304347826087
P(trends_count_drug_adr_hot_results=1|-type_of_example)=0.3
P(trends_count_drug_adr_hot_results=2|-type_of_example)=0.1111111111111111
P(trends_count_drug_adr_hot_results=3|-type_of_example)=0.3
P(trends_count_drug_adr_hot_results=4|-type_of_example)=0.1111111111111111
P(trends_count_drug_adr_hot_results=5|-type_of_example)=0.3
P(trends_count_drug_adr_hot_results=6|-type_of_example)=0.2727272727272727
P(trends_count_drug_adr_hot_results=7|-type_of_example)=0.4166666666666667
Experiment 2 BNN: True Tables
P(+type_of_example)=0.49056603773584906
P(-type_of_example)=0.5094339622641509
P(aers_num_drug_adr_serious=0|+type_of_example)=0.48936170212765956
P(aers_num_drug_adr_serious=1|+type_of_example)=0.2727272727272727
P(aers_num_drug_adr_serious=2|+type_of_example)=0.2
P(aers_num_drug_adr_serious=3|+type_of_example)=0.2
P(aers_num_drug_adr_serious=4|+type_of_example)=0.25
P(aers_num_drug_adr_serious=0|-type_of_example)=0.44680851063829785
P(aers_num_drug_adr_serious=1|-type_of_example)=0.45454545454545453
P(aers_num_drug_adr_serious=2|-type_of_example)=0.2
P(aers_num_drug_adr_serious=3|-type_of_example)=0.2
P(aers_num_drug_adr_serious=4|-type_of_example)=0.375
P(trends_count_drug_adr_hot_results=0|+type_of_example)=0.5102040816326531
P(trends_count_drug_adr_hot_results=1|+type_of_example)=0.1
P(trends_count_drug_adr_hot_results=2|+type_of_example)=0.125
P(trends_count_drug_adr_hot_results=3|+type_of_example)=0.125
P(trends_count_drug_adr_hot_results=4|+type_of_example)=0.125
P(trends_count_drug_adr_hot_results=5|+type_of_example)=0.09090909090909091
P(trends_count_drug_adr_hot_results=6|+type_of_example)=0.2
P(trends_count_drug_adr_hot_results=7|+type_of_example)=0.09090909090909091
P(trends_count_drug_adr_hot_results=0|-type_of_example)=0.3673469387755102
P(trends_count_drug_adr_hot_results=1|-type_of_example)=0.3
P(trends_count_drug_adr_hot_results=2|-type_of_example)=0.125
P(trends_count_drug_adr_hot_results=3|-type_of_example)=0.125
P(trends_count_drug_adr_hot_results=4|-type_of_example)=0.125
P(trends_count_drug_adr_hot_results=5|-type_of_example)=0.36363636363636365
P(trends_count_drug_adr_hot_results=6|-type_of_example)=0.2
P(trends_count_drug_adr_hot_results=7|-type_of_example)=0.36363636363636365
P(new_2=0|+type_of_example)=0.5333333333333333
P(new_2=1|+type_of_example)=0.21428571428571427
P(new_2=2|+type_of_example)=0.14285714285714285
P(new_2=3|+type_of_example)=0.2
P(new_2=4|+type_of_example)=0.2
P(new_2=0|-type_of_example)=0.4
P(new_2=1|-type_of_example)=0.5714285714285714
P(new_2=2|-type_of_example)=0.42857142857142855
P(new_2=3|-type_of_example)=0.2
P(new_2=4|-type_of_example)=0.2
P(new=0|+type_of_example)=0.38461538461538464
P(new=1|+type_of_example)=0.2857142857142857
P(new=2|+type_of_example)=0.25
P(new=3|+type_of_example)=0.42857142857142855
P(new=4|+type_of_example)=0.4666666666666667
P(new=0|-type_of_example)=0.38461538461538464
P(new=1|-type_of_example)=0.2857142857142857
P(new=2|-type_of_example)=0.5
P(new=3|-type_of_example)=0.35714285714285715
P(new=4|-type_of_example)=0.43333333333333335
P(new_3=0|+type_of_example)=0.4482758620689655
P(new_3=1|+type_of_example)=0.4
P(new_3=2|+type_of_example)=0.25
P(new_3=3|+type_of_example)=0.5
P(new_3=4|+type_of_example)=0.3333333333333333
P(new_3=0|-type_of_example)=0.4482758620689655
P(new_3=1|-type_of_example)=0.4
P(new_3=2|-type_of_example)=0.5625
P(new_3=3|-type_of_example)=0.2
P(new_3=4|-type_of_example)=0.16666666666666666
Experiment 3 BNN: True Tables
The complete probability of the network:
The True Tables is included in a text file in Experiment_3_bayes. There are all the conditional probabilities that describe the network.
DrugADR Program
In the data section of this report, we mention the data used by program and talk extensively about the data extraction done by the program. This appendix highlights some aspects of this program $\texttt{DrugADR}$, including how we deal with the “big data” that we use. We work with the NetBeans IDE 7.2.1 using Java 1.7.0_09. Apache Derby is the main server utilized for table construction and oracle. Our program $\texttt{DrugADR}$ has the ability to (1) accept text files and generate tables and (2) analyze the tables to extract features. The program implements many of the fundamental feature extraction details throughout this paper in the class $\texttt{Data}$. The $\texttt{Data}$ class also is responsible for table creation and querying.

Consider case (1) regarding tables created to represent input files. There are 3 types of input files to our program: (a) the FDABBW examples, (b) the quarterly AERS text files, and (c) the csv files from Google Trends keyword searches. Figure [fig:gentables] displays the high-level code in the $\texttt{main}$ function of class $\texttt{DrugADR}$ that is used to create the tables, which calls lower level functionality in the $\texttt{Data}$ class. The FDABBW table is a $$$ delimited file of examples. The $\texttt{Data}$ class will first generate the statement to CREATE the FDABBW table followed by a sequence of INSERT operations to add each record with elements split by $$$. For the AERS files, the tables are provided quarterly from 2004. Each quarter is composed of 8 files, which are $$$ delimited. We do not combine the AERS quarterly tables due to the fact that some records have an incomplete date field and thus, combining tables will lose the partial ordering of the data unless additional fields are added to recall which table the data originated. Also, we notice that when a sophisticated query is performed on one AERS table, the Derby server can be quite slow, even when executing on a quad-core machine with 4GB of main memory. Thus, keeping the data in a quarterly form can produce faster queries. This is desired when a multitude of queries are required, which is the case for our feature extraction algorithms. After downloading all of the AERS text files from the FDA Web site, we load them into a common location data/ascii and call on the $\texttt{Data}$ class collect all of the filenames in data/ascii and perform a Derby DROP and CREATE command to create the table; a series of INSERT commands are subsequently done to insert each record into the table as it appears in the text file. Lastly, the Google Trends data is a comma delimited file. Like for AERS table creation, we store the Google Trends raw data files in a common location data/trends and call on the $\texttt{Data}$ class to perform a number of lower level operations to create a table for both the keyword signals and the top search results. A significant amount of time was required to process the raw data and create the tables, especially in the case of the AERS tables. Once time was spent to initially load the tables, we simply move the folder .netbeans-derby to the current working computer to port the database to different machines and avoid reloading all of the data. The resulting database size is over 3GB.
Consider case (2) of feature extraction. The Data class includes all
of the low level routines mentioned in this paper to extract the
features. For some drug, ADR, and BBW triple $<D,A,W>$, the trick is to
generate feaures by systematically oracling the tables previously
created. That is, dynamically generate a series of queries $Q$ based on
the same conditions (WHERE clauses) and modify the search table to only
consider years and quarters of data prior to the BBW $W$. Execute each
$Q$ and maintain a working list of results. At each step, we can choose
to process the partial results. We observed that working with smaller
queries and performing a series of postprocessing and filtering
techniques to the results was quicker than sending complex queries to
the server, since simpler queries yielded a much faster response time.
The snippet of code in Figure [fig:genfeatures] shows the high level
call used to extract the features and store them in a file, which is
displayed in Figure [fig:featurefile].


Team Member Contributions
Mostly of the coding work has been done by Richard. He worked a lot with NetBeans creating a lot of function to parse thousand of tables, and huge amount of data (Gb) through Derby MysQl database. He wrote part of the final report explaining his part of work.\ \ Marco made a lot of preliminary for literacy review, try to define the problem and which data to use, the source of data from the web, and the entire part with the FNN BNN and performance comparison. Finally the last effort to compose this manuscript. Marco and Richard met frequently to discuss about the project.\ \ Zachary did the webpage and the little experiment on KNN.\ Deng made some little suggestion and the experiment above reported.
]]>